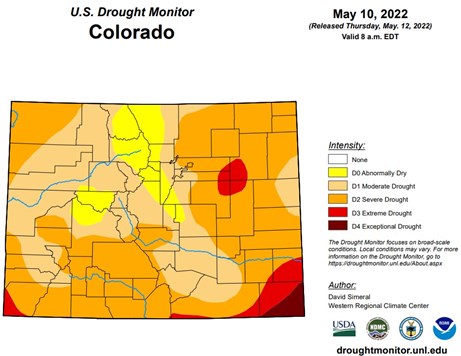
Drought – According to the U.S. DroughtMonitor most of the Roaring Fork Watershed is
experiencing abnormally dry conditions, with a
small portion faring slightly worse at moderate
drought. Grade: B
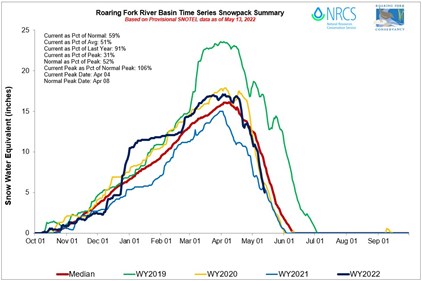
Snowpack – After having a slightly above average snowpack all winter, high winds and warm temperatures during the first week of May decimated local snowpack. In average and above average years, snowpack remains in the high country into June and early July. Snowpack is
currently 60% of average, below where it was at the same time the past two years. This is equivalent to doing your homework all semester, then failing the midterm exam. Grade: D+
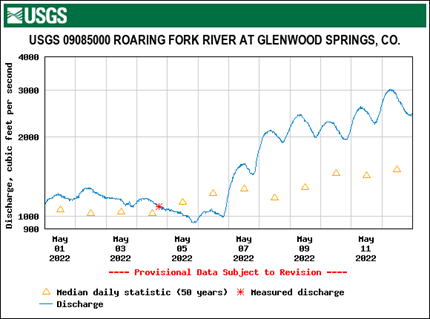
Stream Flows – For the most part, winter stream flows registered below average. At this
point, in early May, stream flows are well above average. However, this is a bit of a mixed
message. Seeing flows above average means local streams reap the benefits of higher
flushing flows - like a “spring cleaning” for the rivers and a necessary component of stream
health. However, runoff appears to be on schedule to peak well before normal, meaning
river flows will drop sooner and run lower longer in the heat of the summer. This puts
local streams at greater risk of exceeding temperature standards and stressing aquatic life.
Grade: C
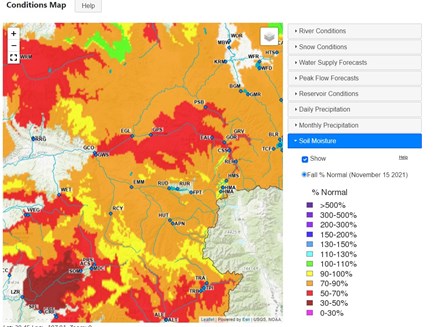
Soil Moisture – Lack of precipitation dries out soils and vegetation. Thirsty soils soak up snowmelt before it reaches the river, which negatively impacts both runoff and summer
base flows. As of November 15, 2021, when soil moisture was last measured prior to snowfall, the Roaring Fork Watershed measured 70-90% of normal. Grade: B
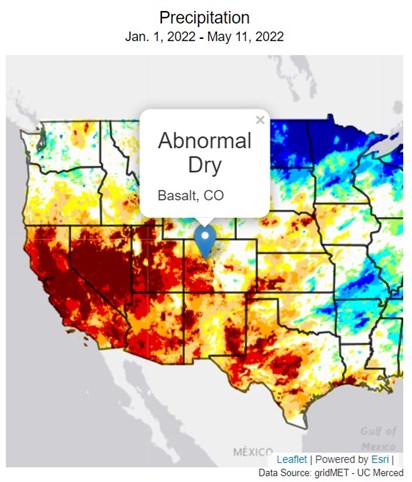
Precipitation – The week between Christmas and New Year, the watershed received an abundance of snow (remember, the water year starts in October, so this still counts). Unfortunately, from mid-January to mid-February western Colorado reported record setting dryness. Basically, we aced the first test, then didn’t show up for class for 4 weeks. A productive storm cycle in late February, early March provided some relief, but was not enough to recover from the month-long absence. Precipitation in Basalt, location of The River Center and (no coincidence) the center of the watershed, is currently classified as “abnormally dry.” Compared to the 128-year period of record for January-April precipitation, Eagle County is experiencing the 18th driest year, Pitkin County its 12th driest year, and Garfield County its 7th driest year. Grade: F
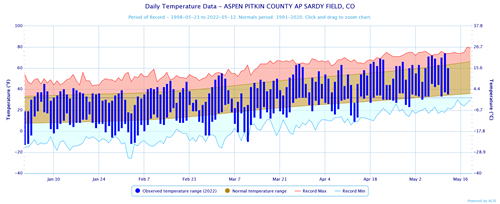
Air Temperature – Since January 1, observed temperatures at Aspen Airport, the one National Weather Service recording station in the watershed, are mostly within the historical average range. In general, temperatures above average are balanced with temperatures below average. In this case, it’s not so bad to be average. Grade: A
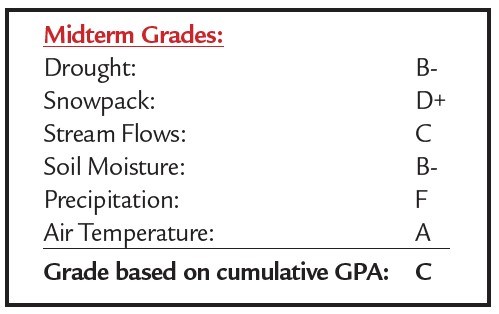
Remarks: Based on our midterm grades, the Roaring Fork Watershed has a solid C average. We performed well in some areas (air temperature) but really dropped the ball in others (precipitation). But we all know, here in the Roaring Fork Valley, no one wants to be average. So, what can we do to bring our grades up? Any extra credit available? Where the Roaring Fork Watershed fairs well, is a component not considered here, water quality. Local rivers (with a few exceptions) score well in most water quality measures. This creates some resilience in a system that can be stressed by factors that are weather-dependent and out of our control. Protecting waterways with adequate setbacks, robust and diverse vegetation, and responsible recreation are all factors we can control that will benefit the watershed in times of stress. While high water quality and the above measures will help in the short term, addressing bigger picture issues like climate change will be key to the longevity of stream health in headwater streams like the Roaring Fork. In the fall, we will assess how the summer season impacted streams and give the “final grades” for the 2022 Water Year!
Grading rubrics can be found here.
References:
https://climatetoolbox.org/tool/Historical-Water-Watcher
https://www.drought.gov/
https://waterdata.usgs.gov/
https://droughtmonitor.unl.edu/
https://nasagrace.unl.edu/Slider.aspx
https://blog.prepscholar.com/what-is-gpa-what-does-gpa-mean
National Oceanic and Atmospheric Administration